Introduction into Storm Chasing
Storm chasing, when most sane people go indoors and anxiously look at the tv or radar on the phone, us storm chasers will drive thousands of miles in hopes of seeing a tornado. I have always been interested in weather, even at 8 years old I was a kid amateur meteorologist for a local TV station in Ohio and reported the weather of that day to them for my little town. I was often scolded by my mom for being outside when storms were approaching as I watched. Throughout all the years I would get in the car with a camera and follow the red square for any Tornado warned storm, having no clue what I was looking for beyond something interesting I could photograph at the great holy grail, a tornado.
I couldn’t tell you the difference between a shelf and wall cloud for many years but it was just awe-inspiring to watch the sky turn almost black where I lived in Ohio for an approaching supercell. It wasn’t 2013 while watching “Storm Chasers” on Discovery channel that it occurred that other people liked to chase after storms and paid $2,500 for a week trip on Extreme Tornado Tours on the Great Plains. It occurred to me that I could learn the skills and save a lot of money and chase myself or with other chasers. I found chasers are everywhere, hundreds if not thousands of us across the world. Easily 10 chasers + in Nashville alone. I’ve been chasing now for 3 years, each storm and year learning more and more. I’m a “noob” as people call themselves in the chasing community.
When I realize what the general public sees as well as what I saw growing up and now what I see. I wanted to share the tools so at the very basic level you can be educated on storms. At the advance side so you can storm chase too.
Storm Spotting as it is officially called with the National Weather Service is important I think for everyone to have some education even if you don’t want to know the advanced level.
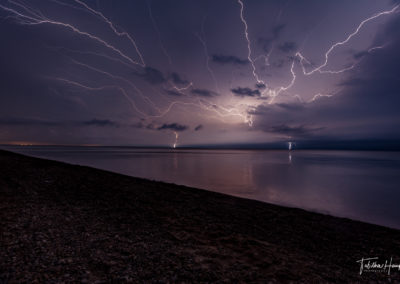
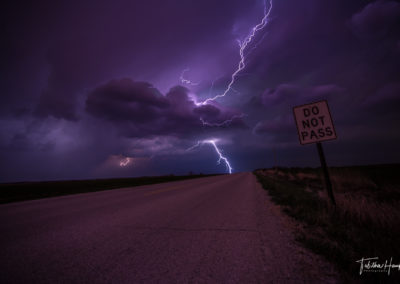
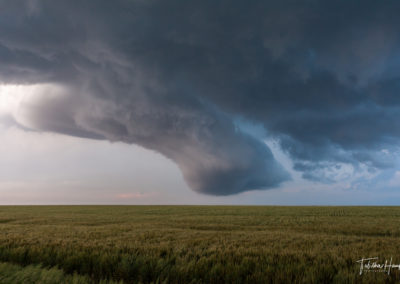
Some of my favorite storm chasing photos I’ve captured.
Your local National Weather Service has basic and advanced storm spotter classes and you should sign up for one. However, you can also view great materials online. Here are the course materials from Norman, Oklahoma. View their Video playlist here.
Field Tactics for Practical Storm Spotting
Storm Spotting Secrets video from one of the best Chasers in the field with a good presentation that can be view here https://drive.google.com/file/d/0By86kQVdyhijdDI4Zm1YOXFmNE0/view?usp=sharing

Radar Weather Channel App on iPhone – this is what most people see

Radarscope App Radar – What Storm Chasers Usually See When Chasing.

What a tornado looks like in Radarscope’s Super-Res Velocity. Basically when two colors on opposite sides come together. So high winds on the red/orange scale meeting high winds on the blue scale. Chasers will usually call it a velocity couplet and Meterologist will often say gate to gate winds couplet on TV.

What a confirmed tornado looks like in RadarScope, the top window is Super-Res Reflectivity (more typical of most weather apps) You can see the hook near Dimmitt, Texas. The Super-Res Velocity shows the extreme windows, no doubt when you see those colors next to each other a tornado exist.
Most storm chasers use Radarscope, some use it for solely on the chase and others use it to supplement other programs such GRLevel3.
Once you have the app installed, it is important to learn what all the radar types and colors actually mean.
Radarscope Video Beam Me Up #1
Radar works very similarly to a flashlight. Join us as we discuss how the location of the radar beam shows us different data than you might think.
- The basics on how radar works
- Data varies for storms at different distances
- Frequent updates and faster data
Video # 2 Reflectivity
What is reflectivity really showing us and should you be concerned when you see scary colors?
- Color tables & rainfall
- The difference between hail & rain
- Reflectivity vs. Super Res Reflectivity
Video # 3 Velocity
Doppler radar data can show if a storm is rotating. What does this mean and why should you know?
- What the red & green colors are actually telling us
- Tornado or just broad rotation
- Velocity vs Super Res Velocity
#4 RadarScope Pro
Do you ever jump back and forth between reflectivity and velocity data on an interesting storm? Now you don‘t have to. Learn why.
- Lightning Data
- Dual-pane viewing
- Longer loops
Storm chasing is a lot of fun, but it can be intense and involves a lot of multi-tasking and being tech savy is important.
Storm Chasing Tools
Radarscope On phone for chasers and basic public (they even have it for mac computers)
I have the Pro edition as well as a monthly subscription to Allison House https://www.allisonhouse.com/ so I have high quality and current data feeds, often just a minute or few minutes old compared to weather channel which can be 30 minutes old at times, I enter in my login details into radarscope as well as placefiles in GRLevel 3.
PYKL3 Radar for Andriod users
SPC’s Convective Outlooks, these help you plan a few days in advance the details of a possible storm chase.
Understanding Basic Tornadic Radar Signatures
Advance Storm Chasing Tools
On my Computer I use GRLevel 3 & SHARPpy for Sounding / Hodograph Analysis
To be able to see other storm chaser positions, sign up for Spotter Network. They are the red dots you see in my radarscope screenshots.
Tornado Titans Website has a lot of good information
U.S. Tornadoes website has a wealth of Tornado knowledge
Stormtrack – a website for storm chasers to talk about forecasting, etc.
https://weather.im/iembot/ – this is what the media sees from the national weather service
The details of storm chasing and meteorology can be seen at this website http://www.theweatherprediction.com/
A good presentation from a great storm chaser https://drive.google.com/file/d/0By86kQVdyhijdDI4Zm1YOXFmNE0/view?usp=sharing
FORECAST:
College of DuPage numerical forecast models
http://weather.cod.edu/forecast/
Skip’s viewer for Earl’s 3km CAPE and LSI plots:
http://skip.cc/chase/models/earlnamsvr.php
Other model links:
http://skip.cc/chase/models/
NOWCAST:
SPC Mesoscale Analysis
http://www.spc.noaa.gov/exper/mesoanalysis/
COD Satellite (1km Products -> Visible shown)
http://weather.cod.edu/satrad/
http://weather.cod.edu/satrad/exper/?parms=midwest-02-200-0 you can see images from the latest GOES-16 satellite
RadarScope: https://radarscope.io/
Satellite data and models
The Recipe for a Thunderstorm
All thunderstorms require three main ingredients with a fourth also mentioned: Mositure, Instability and Lift are the main ingredients along with wind shear.
1. Moisture
Typical sources of moisture are large bodies of water such as the Atlantic and Pacific oceans, as well as the Gulf of Mexico. Water temperature also plays a large role in how much moisture is in the atmosphere. Evaporation is higher in warm ocean currents and therefore they put more moisture into the atmosphere than with cold ocean currents at the same latitude.
Detailed Explanation from theweatherprediction.com
Low level moisture is assessed by examining boundary layer dewpoints. Severe thunderstorms are more likely when the surface dewpoint is 55 F or higher, all else being equal. Low dewpoint values inhibit sufficient latent heat release and significantly reduce the tornado threat.
Tornadoes are more likely when the LCL is relatively low as compared to relatively high. (LCL levels below 1,000 is best) The depth of moisture in the lower troposphere and the rate of moisture advection are also important to examine.
While a lack of moisture in the lower troposphere reduces the severe storm threat, a lack of moisture in the middle troposphere is helpful to the severe storm threat if there is abundant moisture in the lower troposphere. Convective (potential) instability is present in this situation.
The advection of higher dew point values into the boundary layer can increase instability in a severe weather situation. This is often accomplished by advection from a warm ocean source.
2. Instability
Air is considered unstable if it continues to rise when given a nudge upward (or continues to sink if given a nudge downward). An unstable air mass is characterized by warm moist air near the surface and cold dry air aloft.
In these situations, if a bubble or parcel of air is forced upward it will continue to rise on its own. As this parcel rises it cools and some of the water vapor will condense forming the familiar tall cumulonimbus cloud that is the thunderstorm.
Detailed Explanation from theweatherprediction.com
There are different types of instability and each one of these will be discussed. The release of instability causes air to accelerate in the vertical. This is the reason air rises so quickly to form thunderstorms. Instability is a condition in which air will rise freely on its own due to positive buoyancy. As an example, imagine a basketball at the bottom of a swimming pool. Once the basketball is released it accelerates upward to the top of the pool. The basketball rises because it is less dense than the water surrounding it. A similar process occurs when instability is released in the atmosphere. Air in the lower troposphere is lifted until it becomes less dense than surrounding air. Once it is less dense it rises on its own. The speed that is rises depends on the density difference between the air rising and the surrounding air. In any thunderstorm, rising motion is occurring since that air rising in the updraft of the storm is less dense than the surrounding air.
PARCEL INSTABILITY
Parcel instability (also called Static Instability) is assessed by examining CAPE and/or the Lifted Index. Two common measures of CAPE are SBCAPE (surface based CAPE) and MUCAPE (most unstable CAPE). CAPE of 1,500 J/kg is large with values above 2,500 J/kg being extremely large instability. LI values less than -4 are large with values less than -7 representing extreme instability. High instability allows for high accelerations within of the updraft. A strong updraft is important to hail generation. CAPE and LI products from the forecast models can be found at the two links below:
LI: http://weather.unisys.com/nam/nam.php?plot=rel&inv=0&t=4p
CAPE: http://weather.unisys.com/nam/nam_misc.php?inv=0&plot=cape
LATENT INSTABILITY
This is instability caused by the release of latent heat. Latent instability increases as the average dewpoint in the PBL, or in the region that lifting begins, increases. The more latent heat that is released, the more a parcel of air will warm. If the PBL is very moist and humid, the moist adiabatic lapse rate will cause cooling with height of a rising parcel of air to be small (perhaps only 4 C/km) in the low levels of the atmosphere. A storm with an abundant amount of moisture to lift will have more latent instability than a storm that is ingesting dry air. Often storm systems and storms will intensify once they get to the east of the Rockies because more low level moisture becomes available to lift. A Nor-easter is a classic example of latent instability. Warm and moist air from the Gulf Stream or Gulf of Mexico increases latent instability.
CONVECTIVE (POTENTIAL) INSTABILITY
Convective (also called potential) instability occurs when dry mid-level air advects over warm and moist air in the lower troposphere. Convective instability is released when dynamic lifting from the surface to mid-levels produces a moist adiabatic lapse rate of air lifted from the lower troposphere and a dry adiabatic lapse rate from air lifted in the middle troposphere. Over time, this increases the lapse rate in the atmosphere and can cause an atmosphere with little or no Surface Based CAPE to change to one with large SBCAPE (relative to a parcel of air lifted from the surface). Dry air cools more quickly when lifted compared to moist saturated air.
3. A Lifting Mechanism
Typically, for a thunderstorm to develop, there needs to be a mechanism which initiates the upward motion, something that will give the air a nudge upward. This upward nudge is a direct result of air density.
Some of the sun’s heating of the earth’s surface is transferred to the air which, in turn, creates different air densities. The propensity for air to rise increases with decreasing density. This is difference in air density is the main source for lift and is accomplished by several methods (differential heating, terrain, fronts, dry lines and outflow boundaries)
Detailed Explanation from theweatherprediction.com
While instability release is like a basketball rising from the bottom of a swimming pool, lifting is caused by air being forced to rise. Forced lifting is like picking up a bowling ball from the ground or doing a bench press. The object will not rise until a force causes it to rise. It is lifting not caused by the air rising on its own.
Without enough lifting, parcels of air can not be lifted to a point in the troposphere where they can rise on their own due to positive buoyancy. Instability, if it is present, can not be released without the proper amount of forced lifting for the individual situation.
LIFTING MECHANISMS
1. Frontal boundaries, dry lines and outflow boundaries (low level convergence)
2. Low level Warm Air Advection
3. Upslope flow
4. Low pressure system (synoptic and mesoscale)
5. Differential heating along soil, vegetation, soil moisture, land cover boundaries (low level convergence)
6. Low level moisture advection
7. Differential Positive Vorticity Advection, jet streak divergence (upper level divergence)
8. Gravity wave
4. Wind Shear – A fourth ingredient not always mentioned in basic courses is wind shear.
Wind shear refers to a change in wind speed or direction with height in the atmosphere. Wind shear can also refer to a rapid change in winds over a short horizontal distance experienced by aircraft, conditions that can cause a rapid change in lift, and thus the altitude, of the aircraft. Some amount of wind shear is always present in the atmosphere, but particularly strong wind shear Wind shear is important for the formation of tornadoes and hail.
Detailed Explanation from theweatherprediction.com
Strong vertical wind shear is important to severe thunderstorm development. Wind shear influences a storm in potentially several ways:
VERTICAL SPEED SHEAR- Significant increase of wind speed with height
VERTICAL DIRECTIONAL SHEAR- Significant change of wind direction with height
1. A significant increase of wind speed with height will tilt a storm’s updraft. This allows the updraft and downdraft to occur in separate regions of the storm the reduces water loading in the updraft. The downdraft will not cut-off the updraft and actually it will even enforce it.
2. Strong upper tropospheric winds evacuates mass from the top of the updraft. This reduces precipitation loading and allows the updraft to sustain itself.
3. Directional shear in the lower troposphere helps initiate the development of a rotating updraft. This is one component that is important to the development of a mesocyclone and the development of tornadogenesis. Strong lower tropospheric winds and directional shear together will generate high values of Helicity and thus this increases the tornado threat when severe storms develop.


